
Enterprise operations have dynamically evolved along with technological advancements over the years. Today, manufacturing and distribution enterprises want a crystal-clear view of their operations right from planning to execution. Real-time operational visibility is a necessity as compared to yesteryears where only a few big players could afford it.
Enterprises want to make quick, informed decisions at every phase of operations. To do so, they need integrated analytics and business intelligence system within ERP software. A system that provides a visual representation of everything that happens on the floor, highlights inconsistencies, deviations which helps enterprises to take quick and timely decisions based on factual data.
How do dashboards improve the efficiency?
In order to improve efficiency at each phase of operations, enterprises need to adopt technology in the form of ERP software that is feature-rich and helps them scale up exponentially.
An ERP software provides a single source of consistent and quality data, tailored for each department. This helps them to be on top of their individual operations and improve their efficiency and productivity.
Let us look at a key analytical reports/dashboard that ERP software offers.
Manufacturing Dashboards
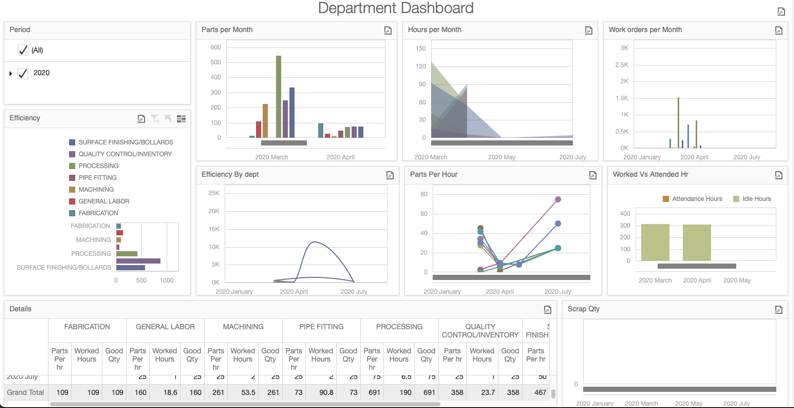
Department Summary
Department summary, as the name suggests, provides an overall summary of the latest happenings on the manufacturing shop floor.
With this dashboard’s intuitive charts and graphs, shop supervisors can track parts created, total man-hours spent, work orders created, attendance & work hours, scrap generated, etc. They can measure efficiency for each manufacturing process as well as for the overall department.
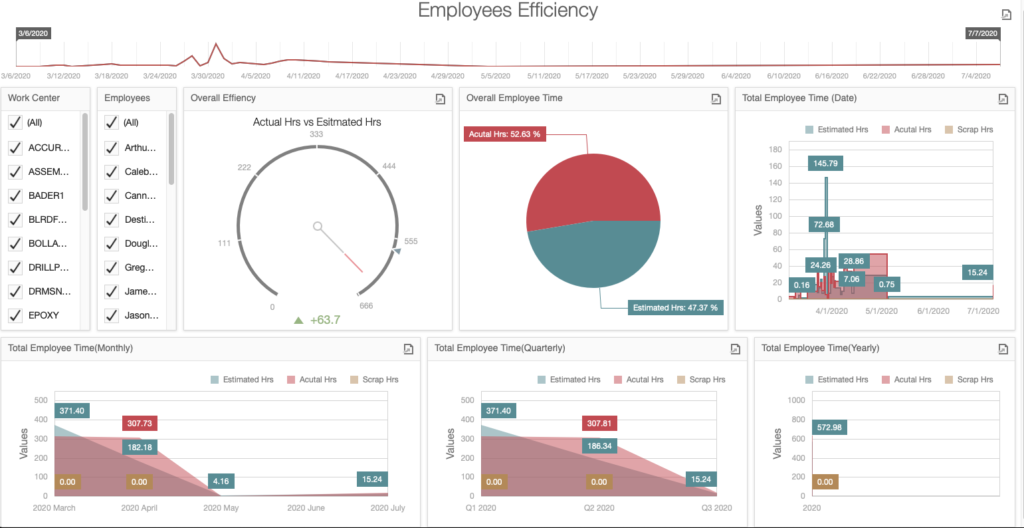
Labor Efficiency
Manufacturing enterprises can track employee productivity through a single-point employee efficiency dashboard within OmegaCube ERP.
Floor supervisors can track work-center and employee-wise data such as,
- Overall employee productivity
- Actual hours vs. Estimated hours
- Total time spent by the employee with daily/monthly/quarterly/yearly breakups
This data helps supervisors and managers to pinpoint the scope of improvement, iron out inefficiencies, and ensure improved productivity of personnel.
Accounting & Sales
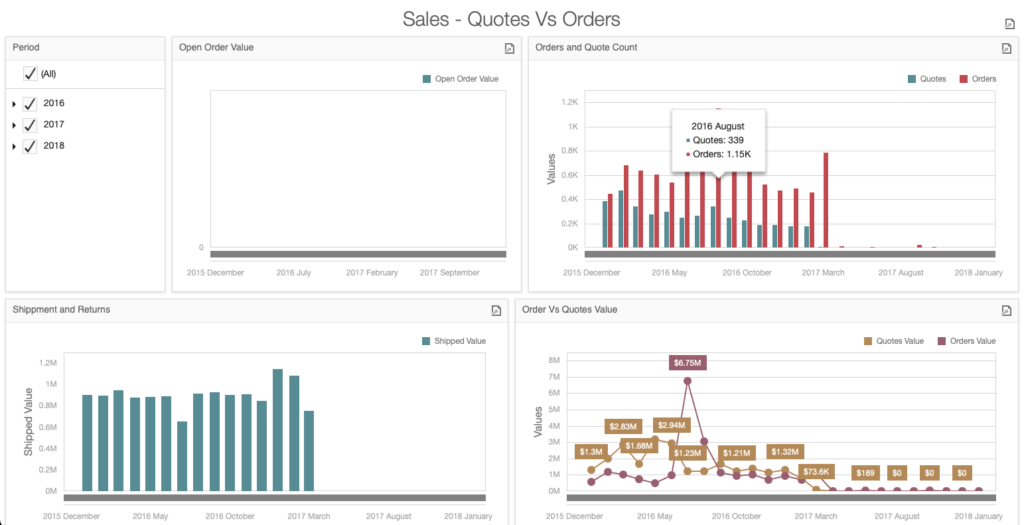
Sales Dashboard
This dashboard provides a 360-degree view of sales performance. Sales personnel can track the number of open orders, open order value, orders vs. quote count & value, total shipping and returns a value.
Profitability & Stability
You can measure their earning power with the profitability dashboard. They can measure gross and net margin that takes into account, total sales, gross/net profit, and gross/margin. You can view a monthly breakup of each margin along with a year-to-year comparison.
Similarly, you can measure your stability with the balance sheet dashboard. The dashboard displays the current, quick, and debt ratio with a monthly breakup. The current ratio graph compares the total current assets, current liabilities, and the ratio between the two. Similarly, the quick ratio graph compares total cash/bank balances, account receivables, and current liabilities. The debt ratio graph compares the debt and equity ratios.
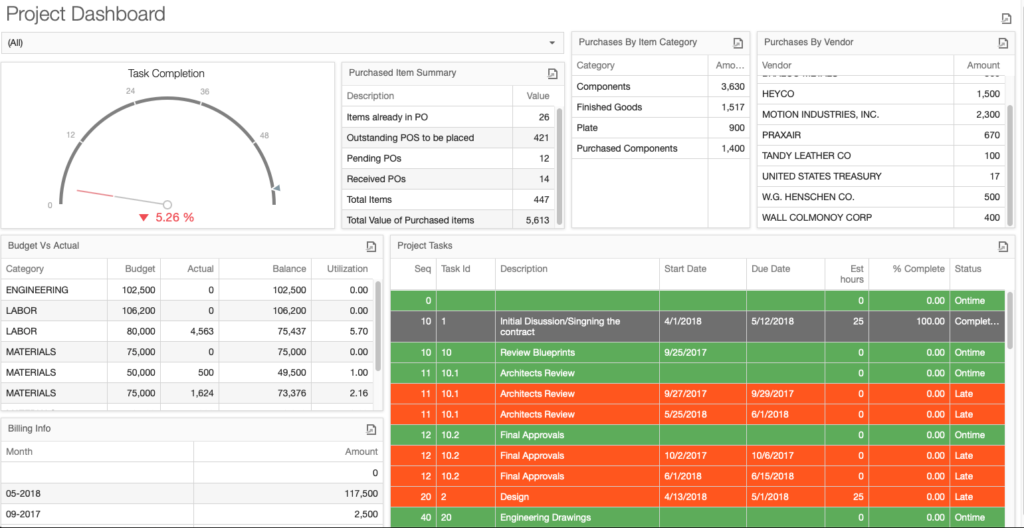
Projects
The project management dashboard offers interesting insights to the projects team. The task completion console indicates the %age of task completion of each project. The purchased item summary displays the value against each phase of Purchase Order progress such as Pending POs, Existing PO items, Received POs, etc.
Personnel can track purchases by item category, and by the vendor. They can compare budget vs. actual for each project category. The project tasks dashboard displays the complete list of tasks along with the start & due date, %age of completion, estimated timeline, and status with color codes.
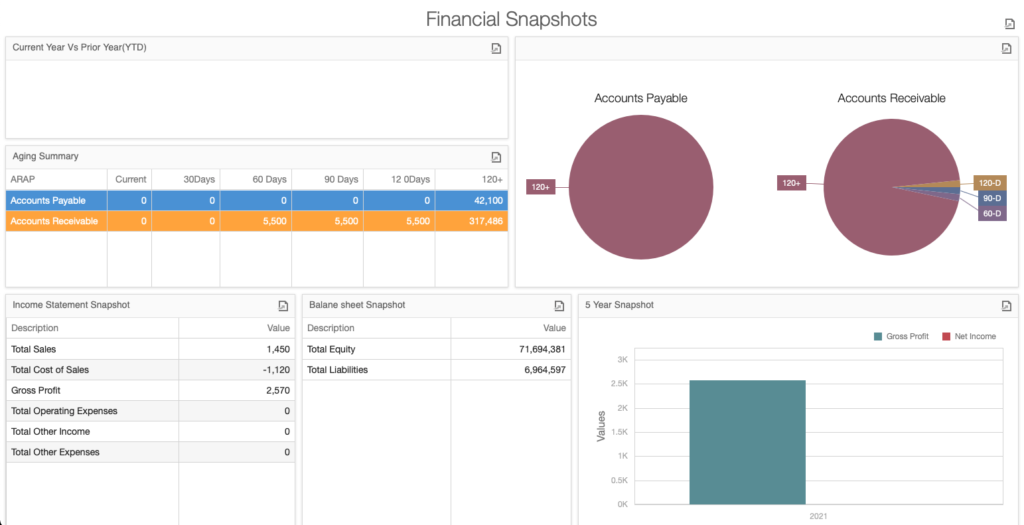
Financials
The finance dashboard gives an overview of Accounts Payable and Accounts Receivable along with the aging summary. The income statement displays total sales, sales value, gross profit, operating expenses, other income, and other expenses. The balance sheet table displays total equities and liabilities value.
Sales & Quotations
The sales and quotations dashboard provides a comprehensive overview of quotations created and their conversion to sales to date. The sales team can view customer-wise quotations that are created, invoiced, lost, and their conversion to sales. They can view the quotations by state, item, territory, country, and customers. Sales managers can filter leads by sales reps and their respective targets too.
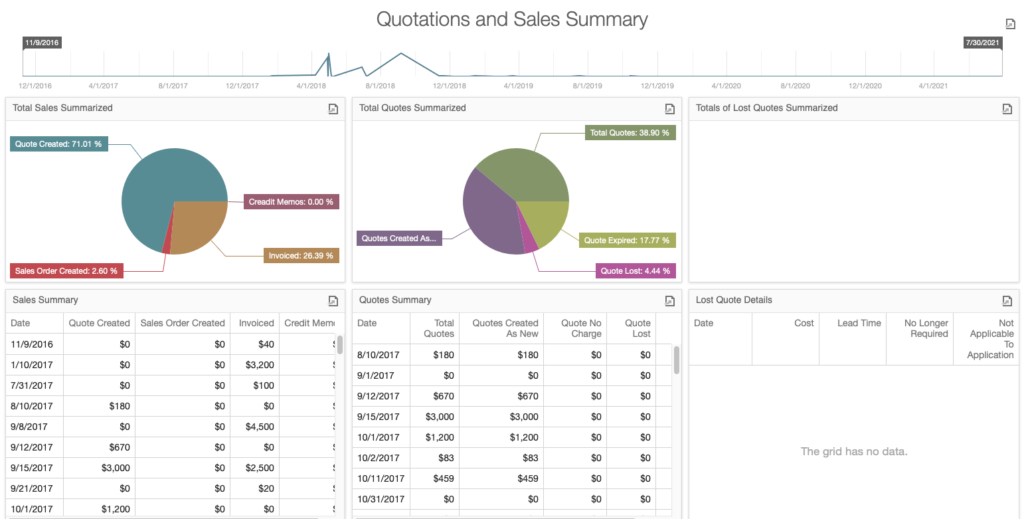
The dashboard also displays quotations that have not been converted to sales, along with their status i.e. pending, lost, won, and submitted. They can view a customer-wise list of quotations along with the value, expiry date, and status.
The sales team can also filter item-number-wise quotations that have been won and lost. They can compare total quotations won vs. lost by count, volume, value, territory, state, and country.
The opportunities dashboard displays the total opportunities that were created for each territory, country, state, product category, lead source, and sales reps.
Customer Profile
The customer profile dashboard provides a comprehensive view of your customers on a single screen. The CRM team can view outstanding invoices, quotations, credit information, work in progress orders, and quarter-wise quotation statistics for each customer.
Inventory
Inventory is one of the most critical functionalities within manufacturing. Low inventory has the potential to derail overall operations leading to late deliveries. To prevent going low on stock, inventory managers can use the inventory usage dashboard to monitor inventory consumption and take adequate measures.
They can analyze inventory usage patterns by item number and type. They can filter the data by year, month, item type, category, subcategory, item number, and warehouse.
The inventory value dashboard also displays top inventory items based on the highest inventory values.

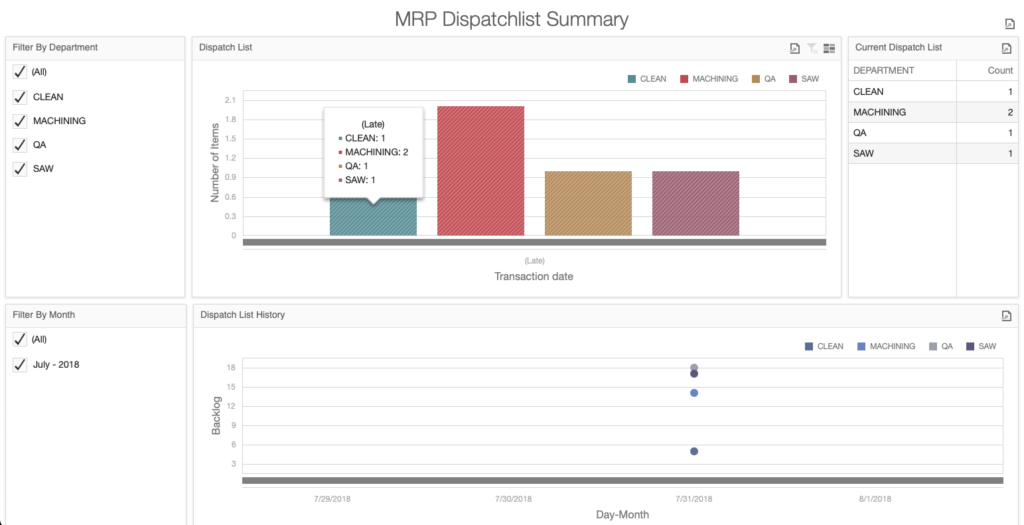
Planning
The planning team can use the MRP dispatch list summary to check department-wise dispatches made on a particular date or month. They get to know the number of dispatches that have already been made and the ones that are in the backlog.
Capacity planning is improved as personnel gets to view overall capacity utilization and efficiency in the form of worked hours vs. scheduled hours.
The material planning team can view the top 10 items that are in shortage for the past 7 days. They can compare materials allocated vs. materials that are in shortage along with item-wise breakup. They also get a breakup of total shortage quantity by items, procurement type, and vendor.
Key benefits of ERP’s analytical capabilities
Single – Unified Source of Truth
Manufacturing and distribution enterprises cannot function on assumptions and half-truths. It only leads to the loss of man-hours and money trying to find the actual truth. Not to mention, operational delay, loss of business, and customer dissatisfaction.
What they need is real-time, consistent data sourced from a single, integrated system, visible across departments, branches, and warehouses.
Data-driven decision-making
When you have all the data in front of you, it becomes easier to make decisions that are strategic, operational, or tactical in nature depending on the situation demanding it. These data-backed decisions are far more effective and have a positive impact on overall operations leading to healthy profitability and bottom-line.
Improved Data Quality & Management
Data is just numbers and a burden on your system if it’s not meaningful and useful to you. An ERP’s advanced analytical features ensure that the right data is displayed to the right personnel in the right format thereby improving their efficiency and productivity. A centralized data repository ensures that data management is trackable at entry and exit points thereby improving data management and sanitization.
Improved efficiency
When you can track processes, man-hours, machine performance, inventory movement, resource utilization, etc. in real-time, you improve productivity, production yield, and on-time delivery. Apart from improving overall efficiency, you are fulfilling the promise that you made to your customers – that of delivering high-quality goods on time.
With the right data in your hands, you reduce overhead costs, increase order-to-cash ratios, and push your enterprise towards exponential growth.
OmegaCube ERP has an in-built OmegaCube Analytics that helps enterprises to get real-time visibility into their performance data across all business functions – from summary to transactional level. Apart from the valuable business intelligence, they can also build rich reports and data visualizations suitable for each role using OmegaCube ERP’s low-code capability and minimal programming.
Get in touch with us for an in-depth demo of OmegaCube Analytics.


5 Responses
Just exploring your services
Non ut quae sit expedita adipisicing minima amet facilis possimus et quae nihil
Omnis deserunt ullam exercitationem temporibus
Voluptas quam Nam quis omnis eveniet voluptatem Doloribus dolore doloremque facilis voluptatem Quis veniam labore accusamus et
Corporis dolorem exercitationem quia neque obcaecati quo sed autem dolor